GraphLangZ Docs
Welcome to the official GraphLangZ documentation! GraphLangZ was designed to be quickly learned in under half an hour.
Table of Contents
To quickly visit any chapter of the documentation, click on any of its links in the table of contents below to be brought to that section of the page.
- What is a Graph?
- Basics: Nodes and Relationships
- Creating Nodes & Edges
- Naming Rules
- Comments
- Edge Labels
- Bracket Syntax
- Global Properties
- node_color
- node_outline
- edge_color
- edge_label_position
- background_color
- highlight_color
- node_shape
- repel_force
- node_size
- resolution
- show_node_names
- extra_time
- fix_conflicts
- Node Properties
- Conclusion
What is a Graph?
Graph Theory, the study of graphs, is a popular topic in mathematics and computer science. The basic properties of a graph is that it has a bunch of objects, referred to as nodes (also known as verticies or points) and the graph also has connections between certain nodes, with the connections known as edges. To learn more about graphs, please consult their entry in Wikipedia.
Basics: Nodes and Relations
Creating Nodes & Edges
The most important task of any graphing software is creating nodes and adding edges between them. To begin, type in the following code and press the "compile" button:
A <> B
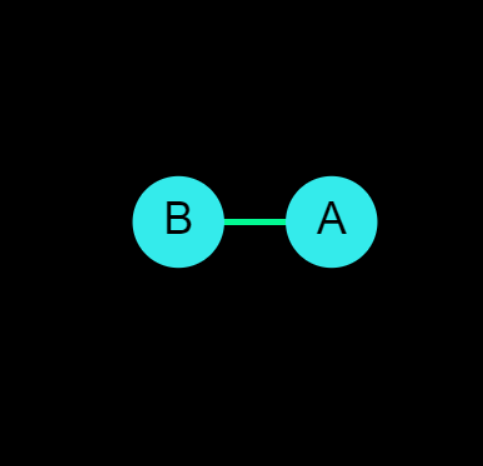
The interpreter will output a graph with two nodes, named A and B, and display an edge between them.
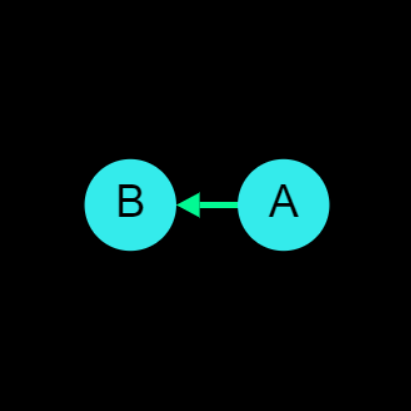
The edge in the above graph was bidirectional because both the < and > signs were included. If you only include one of the signs, then the interpreter will instead create a directional edge pointing from one node to the other.
In the following code, there will be a directed edge from A to B. (If the > sign was used instead, the directed edge would have gone from B to A.)
A > B
Naming Rules
A node's name may begin with a number, have foreign language characters, and it may also contain spaces (thus forming multiple words).
The following characters are all NOT allowed in names:
< > { } ( ) " : = ,
Comments
Like most programming languages, GraphLangZ supports comments. Comments are lines of code that are ignored by the interpreter, and are often included for human readability. Comments are denoted with a double slash // and everything after the double slash for the rest of the line is considered a comment.
// This is a comment!
Edge Labels
An edge between two nodes can have a label. After the second node's name, you can add an optional label surrounded with double quotes.
A <> B "label"

Bracket Syntax
Oftentimes we will need to do repetative things, such as having one node having edges to several other nodes. For example, there could be a graph with nodes A, B, C, and D where we want A to be connected to all other nodes. A simple approach would be connecting A to each node one-by-one with three lines of code:
A > B
A > C
A > D
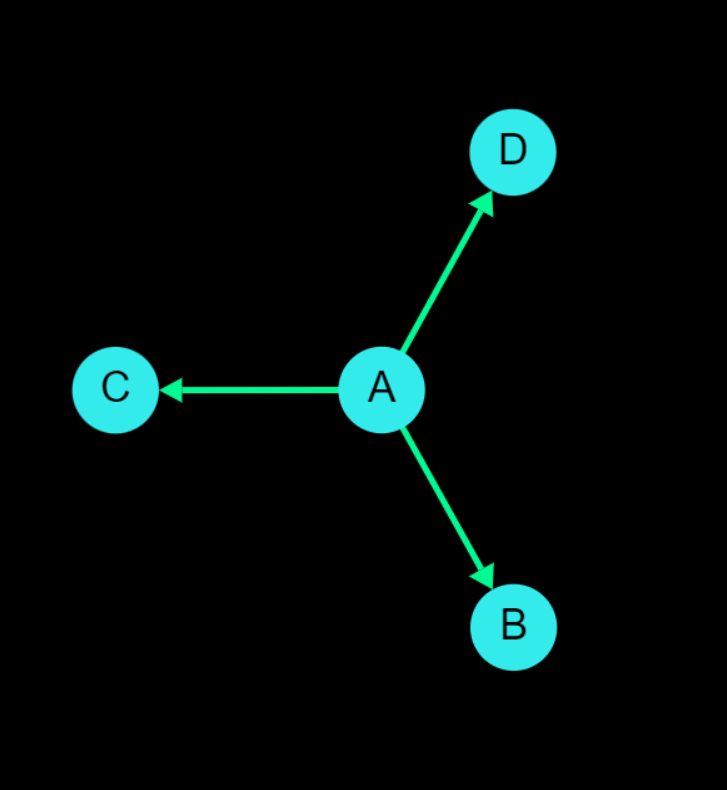
GraphLangZ allows us to simplify the above code into one line using bracket syntax. Here is some code utilizing bracket syntax that achieves the same output:
A > {B, C, D}
In bracket syntax, there is a pair of curly braces that can have as many values between them with each value seperated by a comma. The interpreter will then internally create as many lines of code as there are values, where each line of code has one of the values in place of the brackets, with all other values absent.
When the interpreter reads A > {B, C, D}, it will internally convert it to
A > B, and then the interpreter will parse each of those lines
individually.
A > C
A > D
Brackets cannot be nested; in other words an expression such as {A, {B, C}} would cause an error.
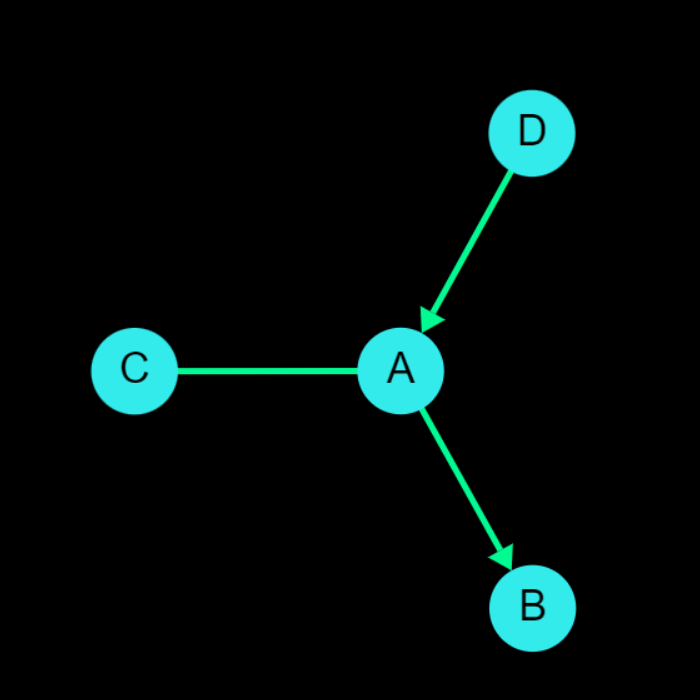
Bracket values are not limited to just node names; edge direction signs and edge labels can also be used within brackets.
The following code creates an edge from A to B, C, and D but specifies different edge directions for each one. A points to B, D points to A, and the edge between A and C is undirected:
A {> B, <> C, < D}
Bracket syntax can be used in a wide variety of instances; here's a more complicated example where a bunch of edges can be declared with a default edge label that can be overriden:
A > {B, C, D "override"} "default"
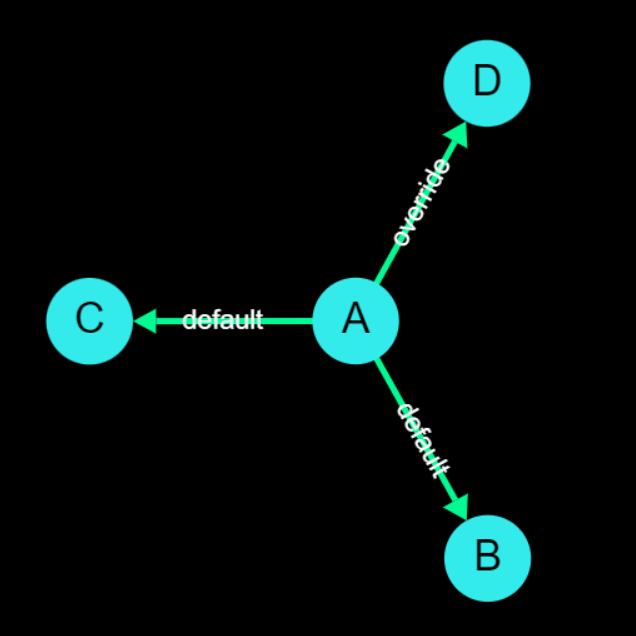
Overall, bracket syntax is a powerful feature of GraphLangZ when used correctly, but has the potential to create confusing errors. As a general programming/debugging principle, whenever you use bracket syntax you should strive to mentally substitute each individual value within the brackets in the line of code to ensure the expression(s) are valid.
Global Properties
While the basic features of GraphLangZ give a great start for displaying graphs, users will often wish to change the appearance further. This can efficiently be achieved with global properties, which are changes applied to the entire graph.
All global properties are initialized with default values, meaning you only need to specify the properties you wish to change.
The syntax of changing a global property is as follows:
#global property value
where "property" is the name of the global property you want to change and "value" is the value you want to set it to.
Below is a list of all global properties and the values they can be set to:
node_color color
node_color changes the default color of all nodes in the graph.
Note that a node declaration (explained later on) can override this default color for nodes, allowing you to display individual nodes in different colors.
The example below will make all nodes colored blue by default; A different color name or hex value can be substituted for "blue"
#global node_color blue
Multiple colors can be specified seperated by spaces. The example below will make all nodes colored 1/3 blue, 1/3 red, and 1/3 green by default:
#global node_color blue red green
node_outline color
node_outline changes the default color that nodes are outlined with. By default, nodes do not have any outline.
Note that a node declaration's settings (explained later on) can override this default outline color for nodes, allowing you to display individual nodes with different outline colors.
The code below will make all nodes have a yellow outline by default; A different color name or hex value can be subsituted for "yellow".
#global node_outline yellow
edge_color color
edge_color changes the default color of all edges in the graph.
unlike node_color, there is no way to override this default color for edges.
The example below will make all edges colored red; A different color name or hex value can be subsituted for "red"
#global edge_color red
edge_label_position
edge_label_position changes the relative location that labels are displayed on edges.
The following values for edge_label_positions are supported:
- inline (default value)
- raised
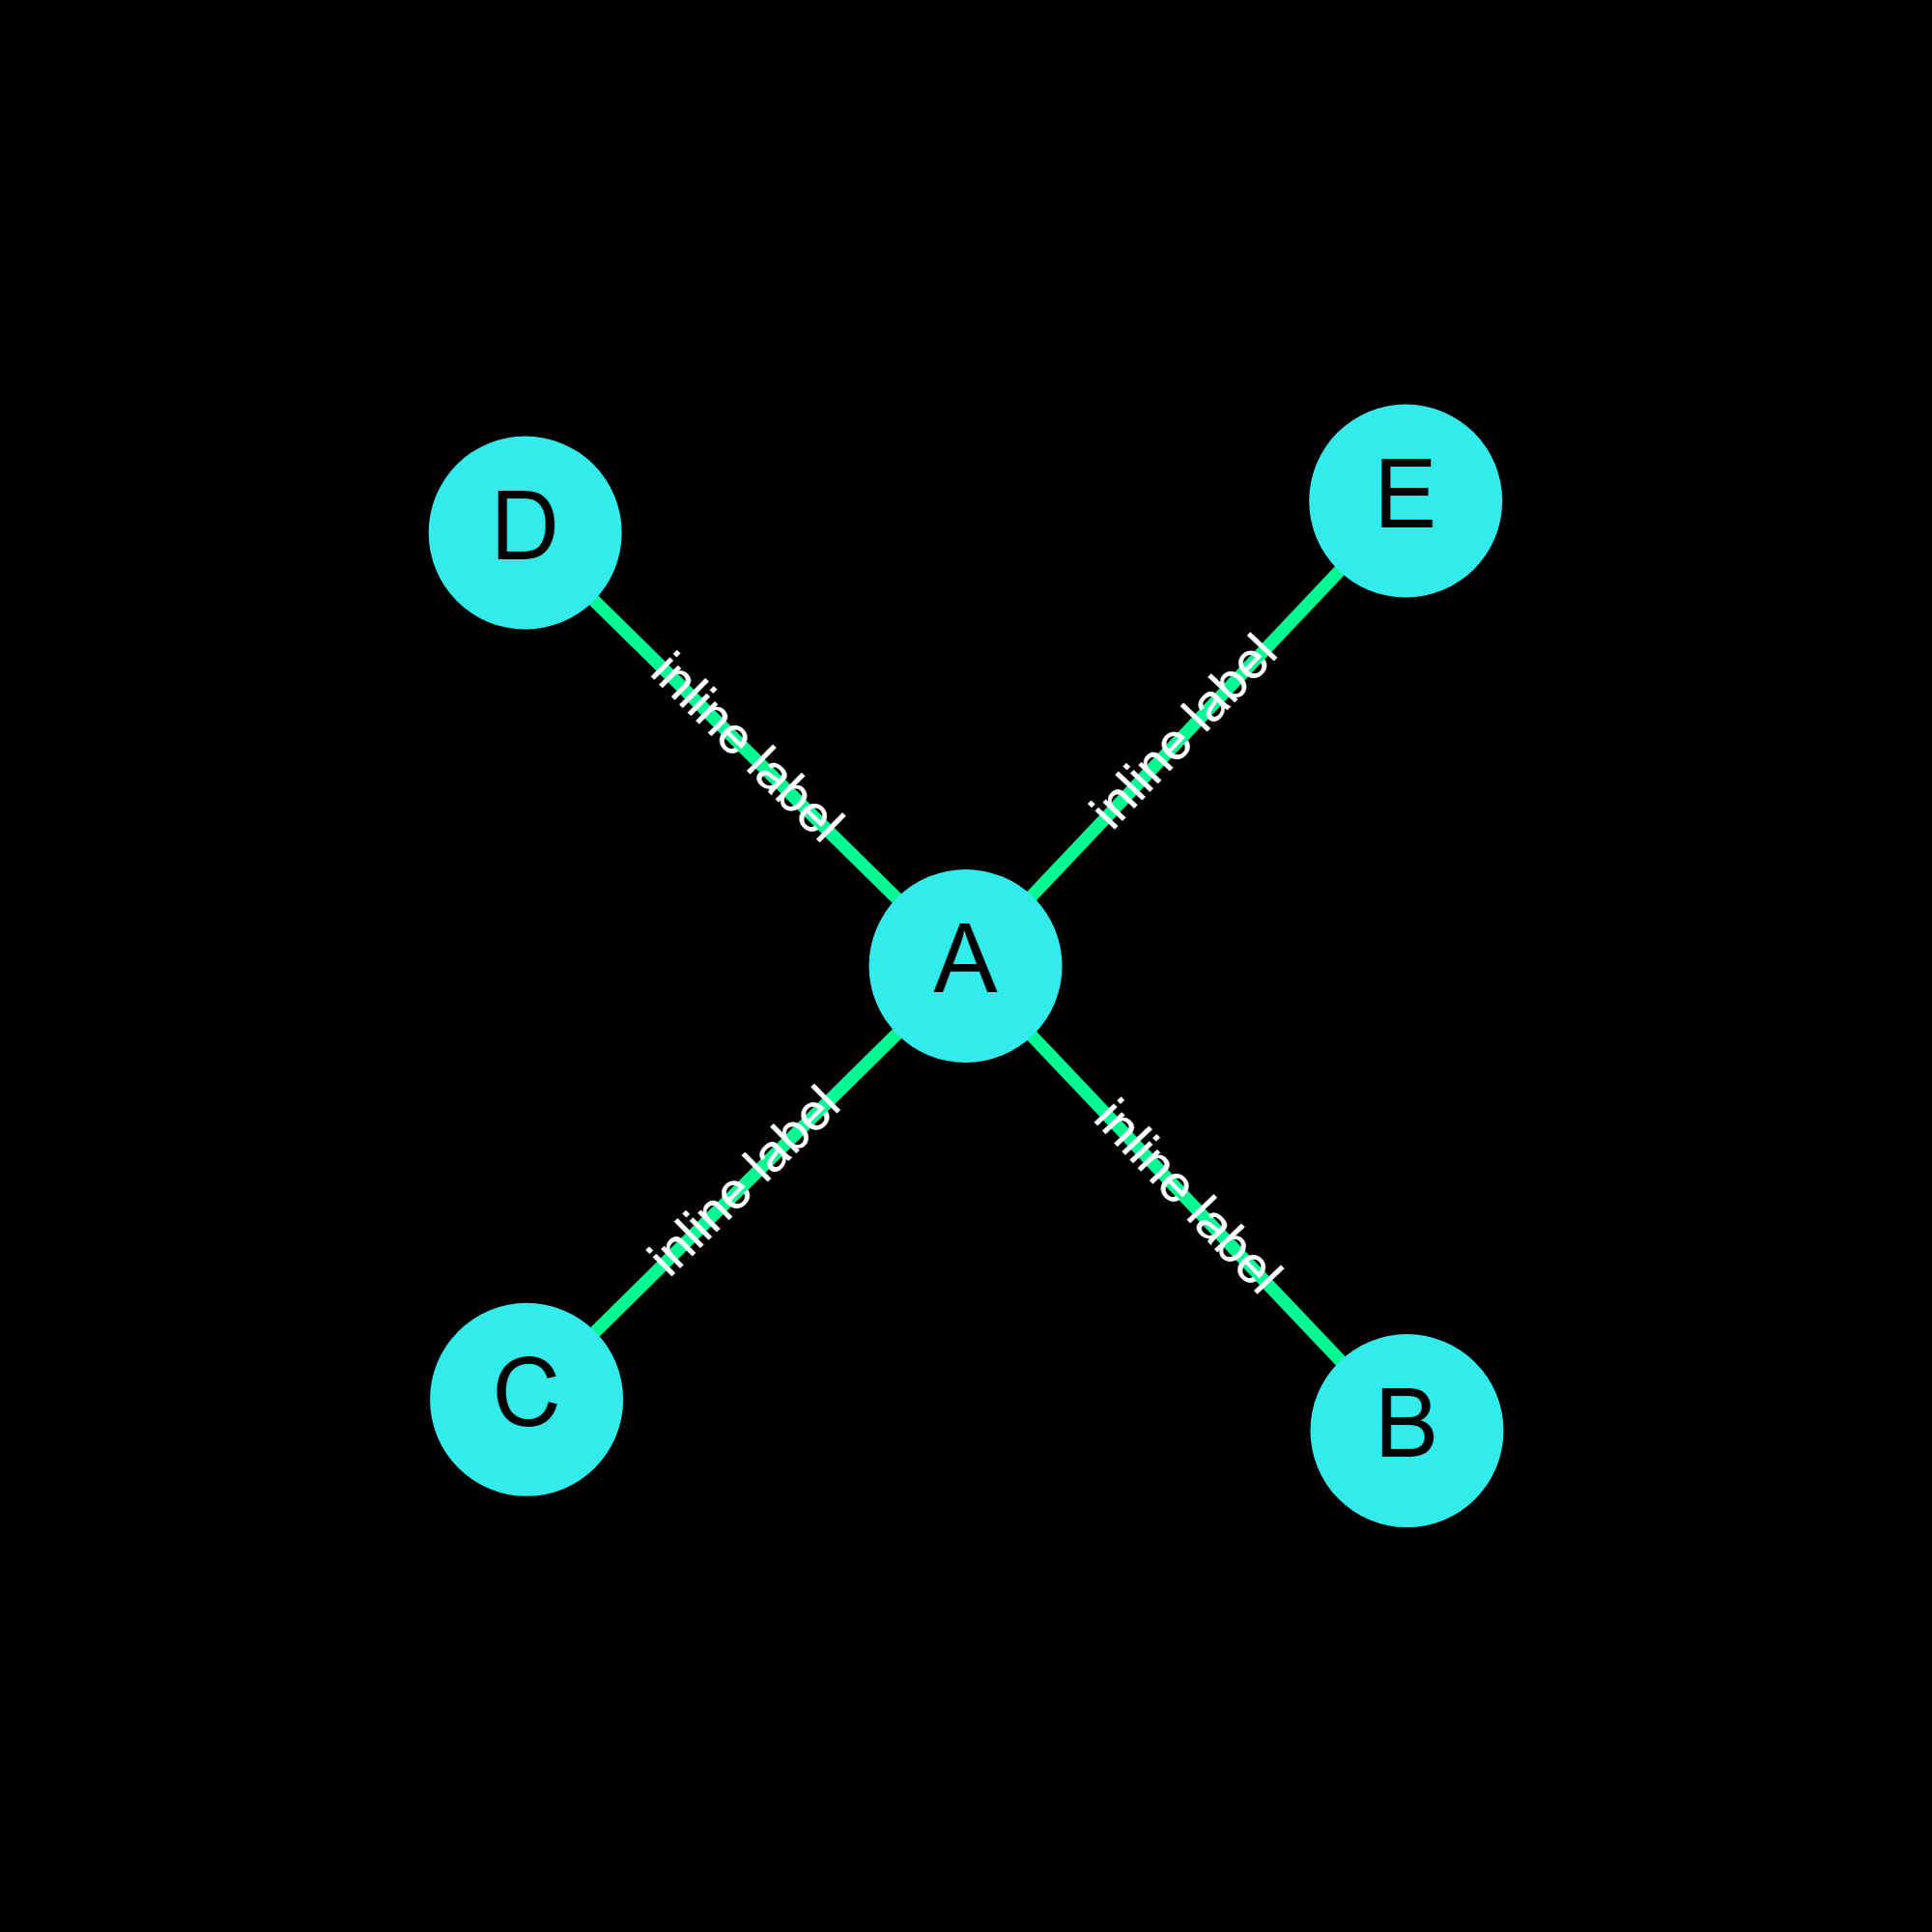
An "inline" label is text written directly in the middle of the edge's line. A "raised" label is written above the middle of the edge's line.
The example below will make all edge labels be displayed on the edge line:
#global edge_label_position inline

                A <> {B, C, D, E} "inline label"
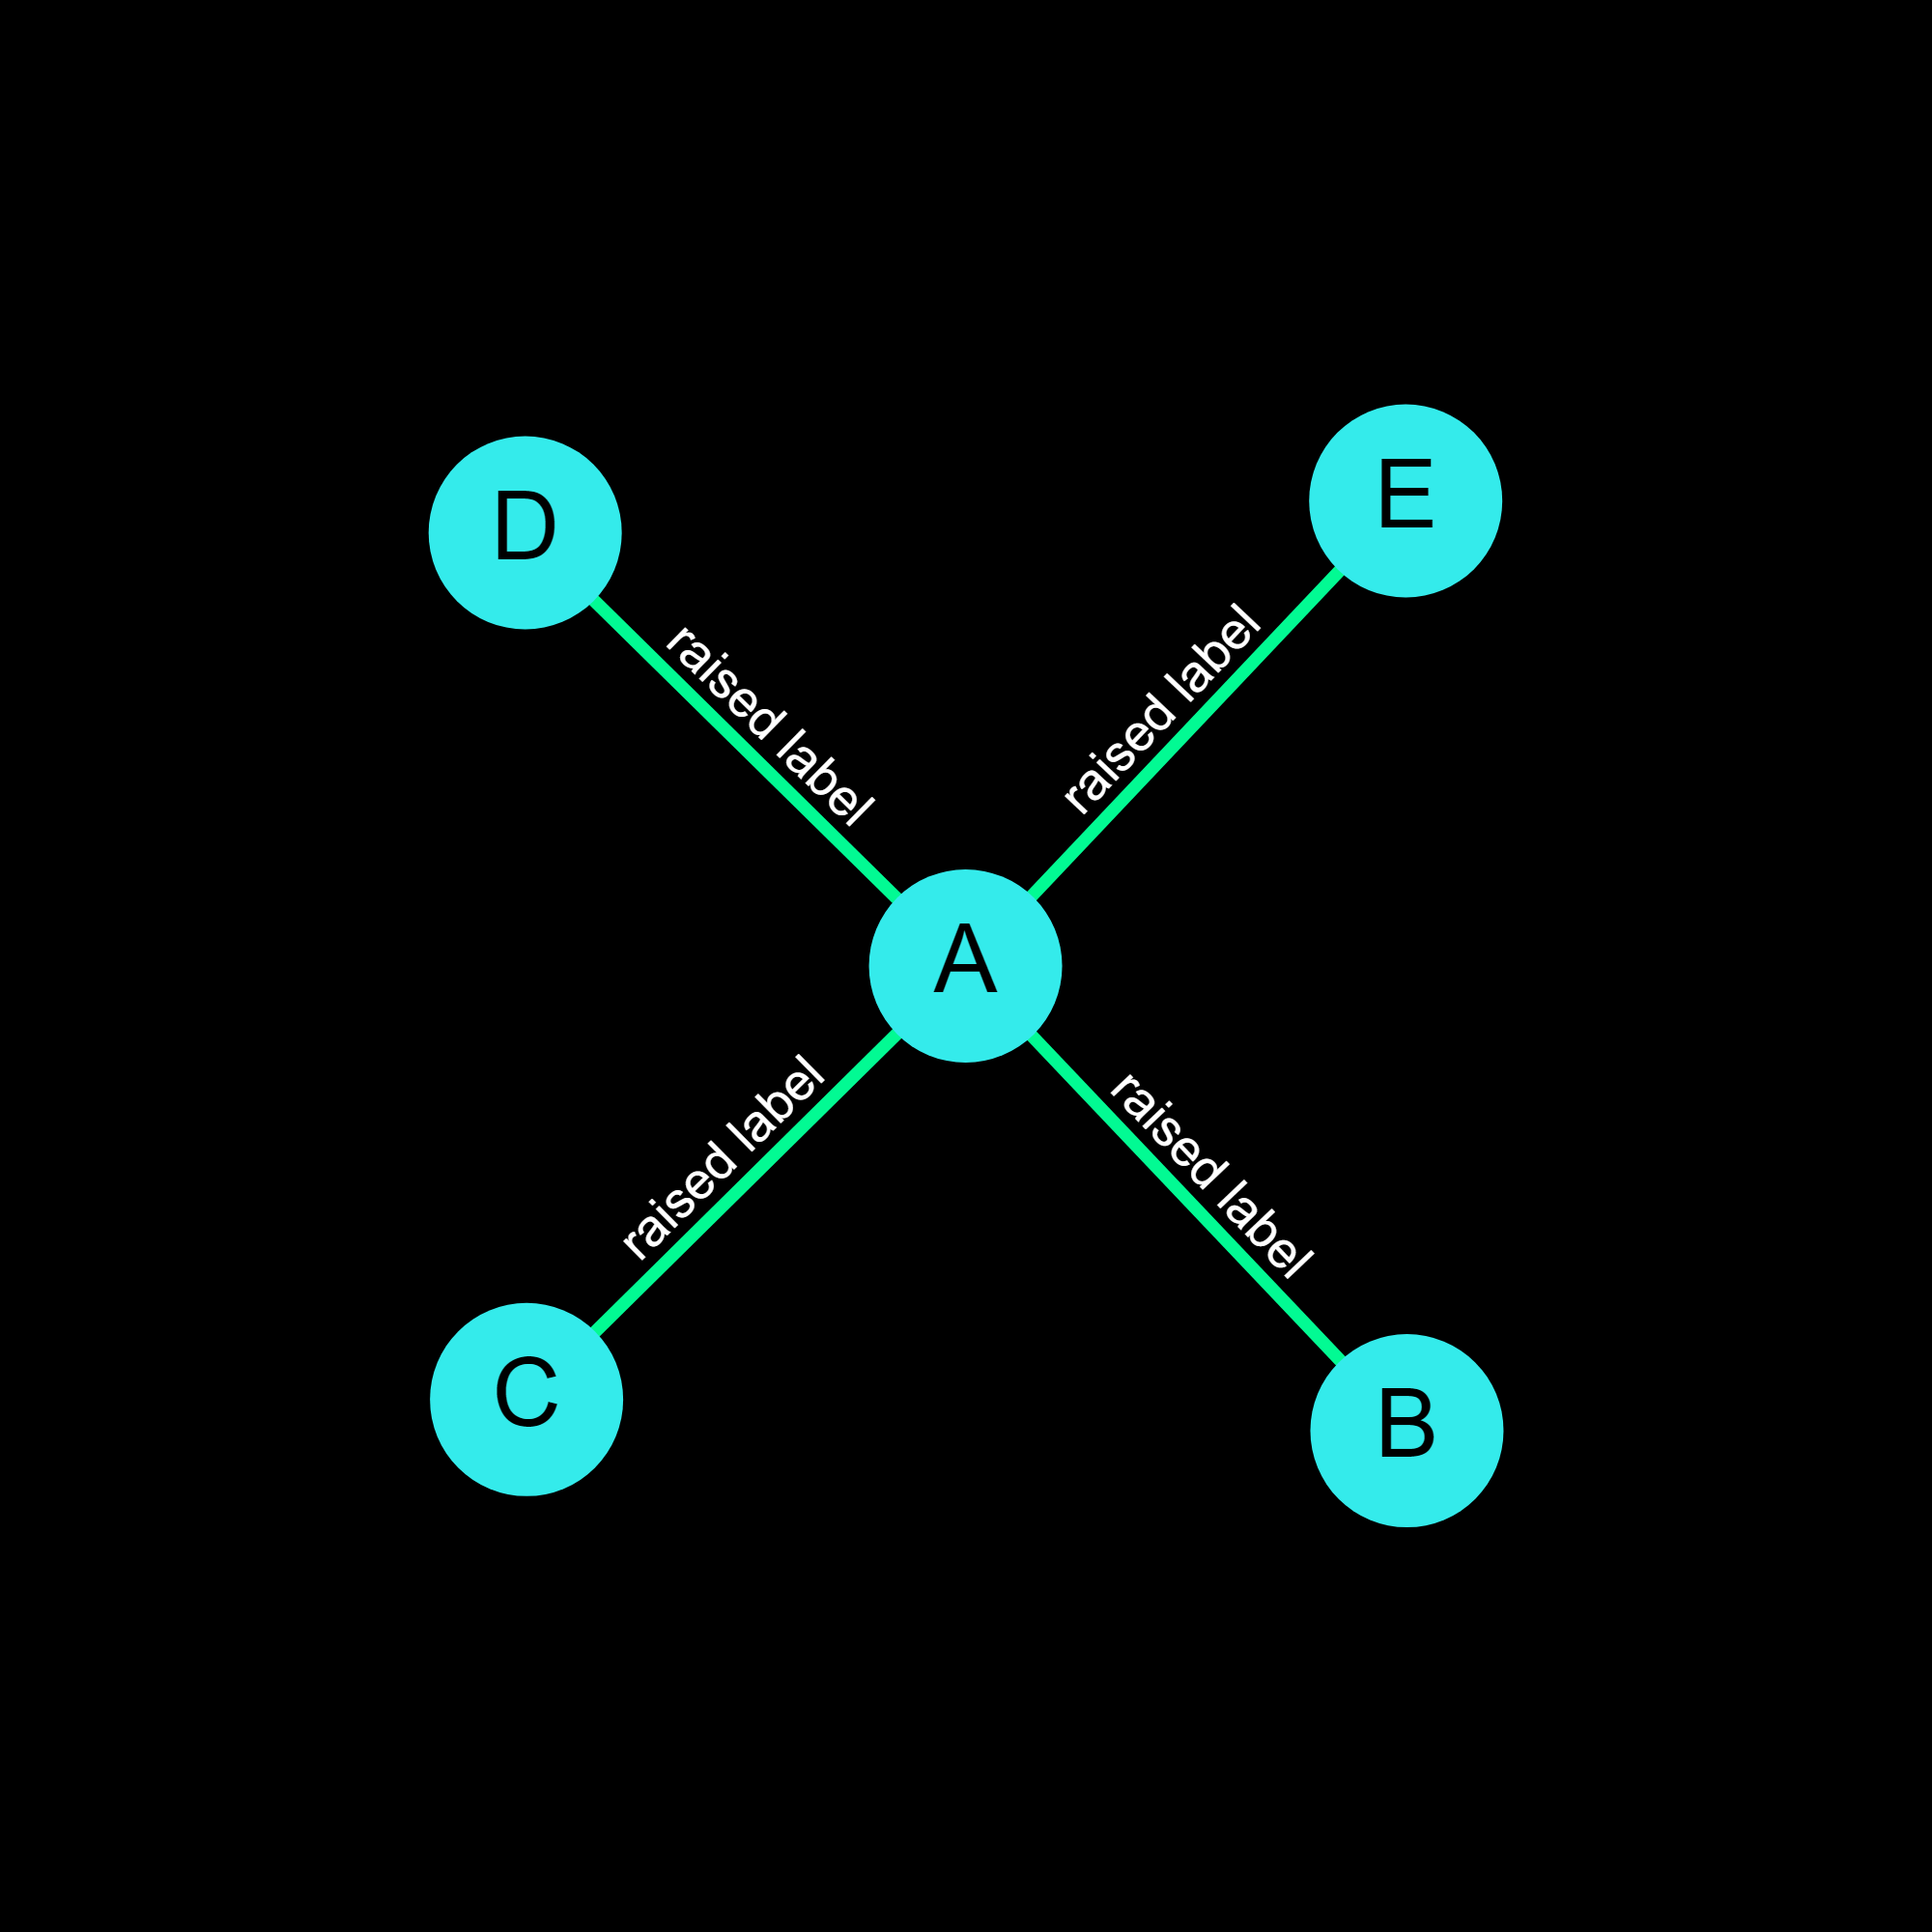
The example below will make all edge labels be displayed above the edge line:
#global edge_label_position raised

                A <> {B, C, D, E} "raised label"
background_color color
background_color changes the background's color. The default value for background_color is "black".
In addition to using any standard color, the value "transparent" can be used to make the graph's background transparent. While the graph's background appears to be a solid color in the editor, the graph has a transparent background when downloaded as an image.
The code below will make the graph have a green background:
#global background_color green
The code below will make any image downloads of the graph have a transparent background:
#global background_color transparent
highlight_color color
highlight_color changes the color that nodes appear in when they are highlighted. A node is highlighted whenever a mouse hovers over it or one of its neighbors.
#global highlight_color charcoal
Unlike the node_color property, highlight_color only supports singular colors (i.e. you cannot specify multiple colors).
node_shape shape
node_shape changes the default shape of all nodes in the graph.
Note that a node declaration (explained later on) can override this default shape for nodes, allowing you to display individual nodes in different shapes.
The following shapes are supported:
- circle (default value)
- triangle
- square
- pentagon
- hexagon
- octagon
The example below will make all nodes have a hexagon shape by default.
#global node_shape hexagon
repel_force number
The repel force is how much nodes repel each other, with higher numbers causing the graph to be spread out more and lower numbers compressing the graph. 100 is the default value, and all other values correspond to a percentage of the default value.
The example below will set the repel force equal to 50% of the default repel force:
#global repel_force 50
Note that there is no percent sign in the value; including a percent sign would cause an error.
node_size number
The node_size property determines what each node's diameter is, as a percentage of the graph's width. Please be careful of setting this value too high as it can cause the graph to not render anything. Try starting with low values first and slowly increase them. When the node_size global setting is not specified, all nodes get a default node_size based off of how many nodes there are in the graph.
The code below will make all nodes have a diameter that is 5% of the graph's width:
#global node_size 5
resolution number
The resolution property determines the graph's resolution when downloaded as an image. The default resolution value is 2000. Note that the resolution property does not change the graph's display resolution in the editor; the resolution of the interactive graph output is determined by your specific screen / hardware.
The resolution property has a maximum value of 10000.
The code below will make any image download of the graph be 1600 by 1600 pixels.
#global resolution 1600
show_node_names boolean
show_node_names can be set to either true or false, and determines of the names of nodes are displayed. When set to false, all of the nodes will just be circles with no text on them; this makes the graph less informative and abstract. The default value of show_node_names is "true".
#global show_node_names false
extra_time boolean
extra_time can be set to either true or false. When set to true, the interpreter will try more graph layout combinations possibly improving the graph's layout. The drawback of setting extra_time to true is that it increases compilation time. The default value of extra_time is "false".
#global extra_time true
fix_conflicts boolean
fix_conflicts can be set to either true or false. When set to true, the interpreter will try improving the positions. Setting fix_conflicts to false will make the interpreter do zero correction. In general it is recommended to have the fix_conflicts setting be true for graphs of less than 20 nodes for the the best quality output, but for graphs with large node counts such as 50 setting fix_conflicts to false immensely speeds up compilation time and doesn't lead to much of a noticeable drop in quality. The default value of fix_conflicts is "true".
#global fix_conflicts false
Node Properties
Node Properties are similar to global properties, except that they are attributes that apply to only specific nodes, not the whole graph.
Similar to global properties, all node properties are initialized with default values, so you only need to specify the properties you wish to change.
The syntax of changing a node property is as follows:
NodeName := property1(value1) property2(value2) ...
where "NodeName" is the name of the node you want to change, "property" is the name of the node property you want to change and "value" is the value you want to set it to. You can specify multiple node properties in the same line.
Below is a list of all node properties and the values they can be set to:
color color
The color property allows the user to specify the color of the node. This color always overrides the global node_color property.
The code below will make a node called "Example" have a red color.
Example := color(red)
Similar to the global node_color property, the color property for individual nodes also supports multiple colors seperated by spaces. The code below will make a node called "Example" have 1/2 a red color and 1/2 an orange color.
Example := color(red orange)
outline color
The outline property allows the user to specify a color to outline a node with. By default, nodes do not have any outline.
The code below will make a node called "Example" have a pink outline.
Example := outline(pink)
label text
When the graph is rendered, each node displays the text of its name by default. However, you can choose to display some different text via the label attribute.
There are two main reasons to use the label property instead of just using the node's name:
- You want to have the same text displayed on more than one node. No two nodes are allowed to have the same name, but multiple nodes may have the same label text value.
- You want to have the node's name in the code be short (such as an abbreviation) while displaying longer text for the label.
The code below will make both nodes Node A and Node B have the text "apple" displayed in the program output.
{Node A, Node B} := label(apple)
By default, each node's label is the same as the node's name (thus the node's name is displayed)
center no value
The center node property makes a node be displayed as close as possible to the center of the graph. You may apply this property to multiple nodes; the interpreter will try to render all "centered" nodes as close to the center as possible while avoiding any overlap between them. This node property does not use any value between its parenthesis.
The code below will make a node called "Example Node" displayed in the center.
Example Node := center()
left, right, up, down no value
Similar to the center property, the left/right/up/down property makes a node be displayed as close as possible to the direction specified. You may apply multiple direction properties to different nodes; these combinations can be used to make a node move towards a corner (e.g. left & up) or move towards the vertical/horizontal center (e.g., left & right makes the node horizontally centered, but not necessarily vertically centered. This node property does not use any value between its parenthesis.
The code below will make a node called "Example Node" displayed in the top-left corner.
Example Node := left() up()
pos numbers
The pos property, shorthand for position, overrides all default graph formatting and determines exactly where a node will appear on the graph. There are two values specified within the parenthesis, an x-position and a y-position. (0,0) is the top-left corner and (100,100) is the bottom-right corner of the graph, with (50,50) being the center.
While this property can be adjusted manually in the code (just like all other node properties), guessing the precise position numbers needed can be inconvenient.
Rather than adjusting the position manually in the code however, a much easier alternative exists.
After compiling the graph, you can change the positions of the nodes by dragging & dropping a node with the mouse on the output window. Moving a node with the mouse will automatically update the code to reflect the node's new position, so recompilation leads to the same result.
Depending on what code already exists, it will be changed in one of the three following cases:
- If a node already has a pos property specified, the values of it will be overwritten.
- If a node has other properties declared but not a pos property, the pos property will be added to that line of the code.
- If a node has no properties declared, a new line will be appended to the end of the file declaring the node's pos property.
This convenient GUI drag & drop feature allows you to never worry about manually typing in positions - just move it visually to wherever you want and the code updates will follow in the background!
The example code below will position a node 30% away from the graph's left border and 60% away from the top border:
Example Node := pos(30, 60)
shape shape
The shape property determines what the shape of a node is. All of the shapes supported by the global node_shape property are supported by the node shape property. The default value is "circle". Changing a node's shape does not alter the graph layout in any way.
The example code below will give an example node a square shape.
Example Node := shape(square)
repel_force number
The node property repel_force is how much the individual node experiences repulsion forces from other nodes, as a percentage of the default global repel_force. Values above 100 cause the node to be repelled by other nodes more than normal; values below 100 cause the node to be repelled by other nodes less than normal. The default value of each node's repel_force is 100.
The example code below will make a node be repelled by other nodes 80% as much as the default magnitude.
Example Node := repel_force(80)
Bracket Syntax
Similar to how bracket syntax can be used to make multiple edges in one line, bracket syntax can also be used to apply node properties to multiple nodes in one line. The following code will make both Node A and Node B have a red color:
{Node A, Node B} := color(red)
Conclusion
Congratulations, you have finished reading the entire GraphLangZ documentation! If there appears to be any mistakes please do not hesitate to contact us :)
To learn more about the GraphLangZ project, please visit the About page.