Hexagonal Light - Documentation
Overview
Welcome to the Hexagonal Light documentation page! Hexagonal Light is a program that allows users to input
categorical data, and generates an interactive graph from it. Read the rest of the documentation page to
learn how to use Hexagonal Light.
Website Layout
Hexagonal Light has the following website layout:
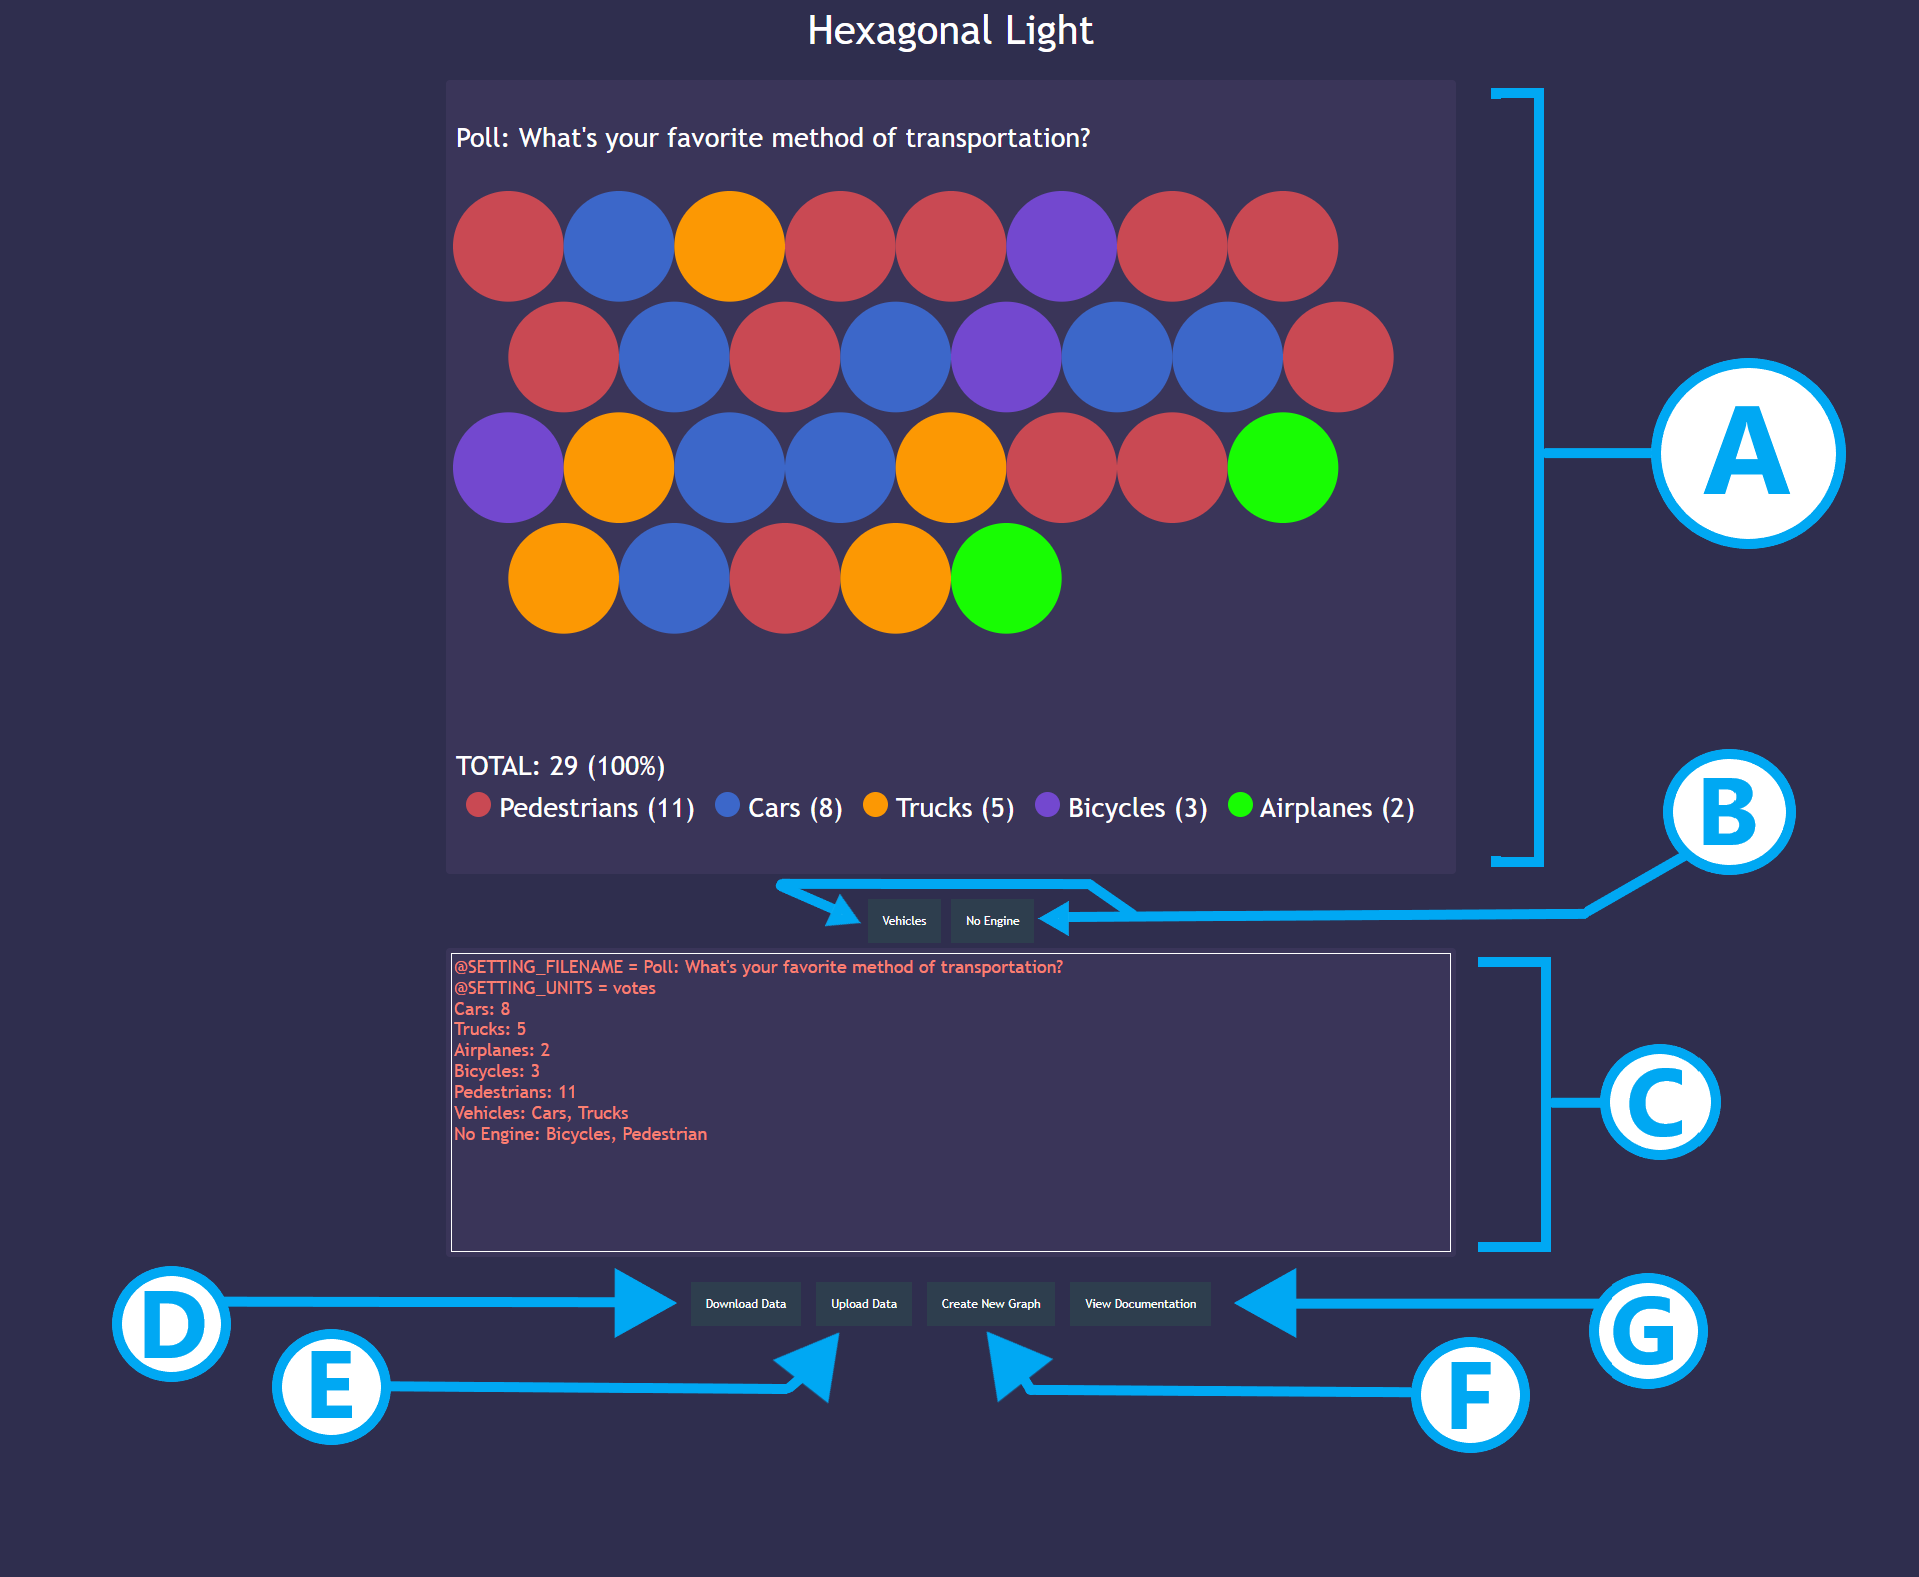
- A: Graph Output zone. This is where the graph is viewed and interacted with.
- B: Collection buttons. When clicked, these buttons display only the members of their
respective Collections (Collections are defined later in this documentation).
- C: User Input Textarea. This is where the user types information that the user wants to
display on the graph.
- D: Download Data Button.When clicked, all of the content in the User Input Textarea will be
downloaded as a text file (.txt).
- E: Upload Data Button. When clicked, the user will select a text file from their computer.
The file's contents will then be written into the User Input Textarea and the new text will be
parsed and compiled to create a new graph.
- F: Create New Graph button. When clicked, the compiler parses the text in the user input
textarea, and updates the graph.
- G: View Documentation button. When clicked, a documentation page should open up in a new tab.
User Input
Hexagonal Light uses a very basic "programming" language that allows users to input data. The
programming language has two main components: Data Groups and Collections. Comments and miscellaneous
settings are also included in the language.
Data Groups
Data Groups are the core feature of Hexagonal Light. Each Data Group specifies a category name, and a
corresponding value for that category. Some examples of Data Groups are: 8 cars, 5 trucks, 3 bicycles, 6
walking, and 1 helicopter.
To declare a Data Group, type its name first and its value after it, seperated by
a colon character.
Cars: 8
Trucks: 5
Bicycles: 3
The above code will generate the following output:
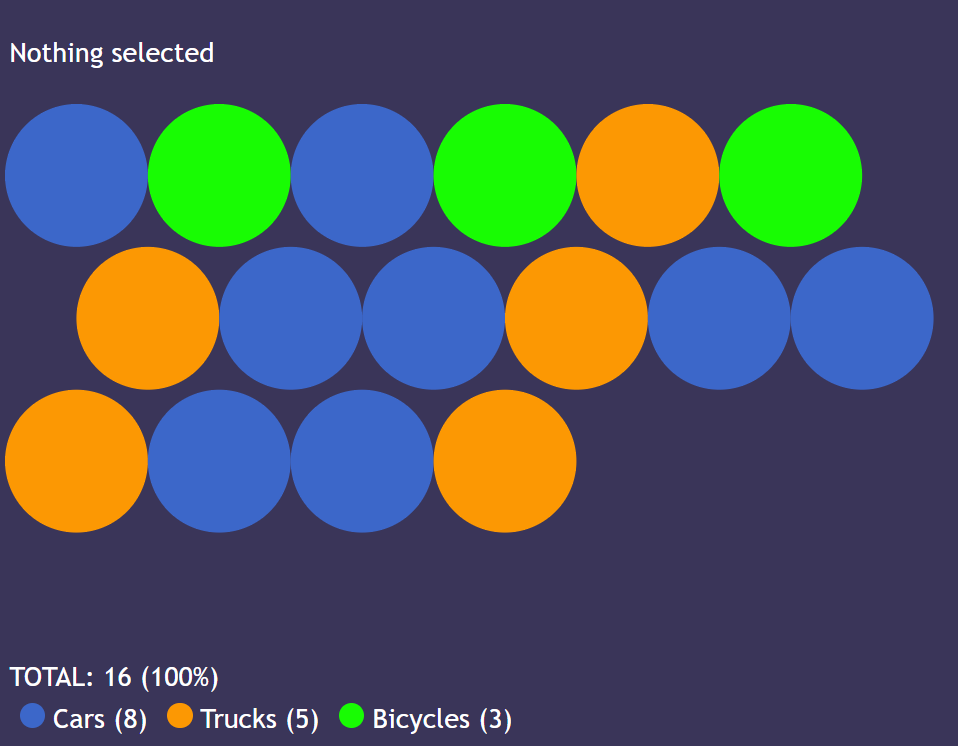
When the compiler reads a Data Group declaration, it will add circles to the graph that each have the data
group's name. For example, if a Data Group named "Cars" is declared with a value of 8, the output graph will
have 8 circles named "Cars". A Data Group named "Trucks" with a value of 5 will result in the output graph
having 5 circles named "Trucks", and so on.
Some rules about values:
- A value must be a number, containing only the digits 1-9. Letters and special characters are not
permitted.
- Values must be positive. Negative numbers will cause errors in calculating the total number of
items, and there will be circles missing in the graph output.
- Values must be integers. Because only whole circles are displayed (no fractions of circles), decimal
values cannot be properly rendered and will cause errors.
In addition to stating the size of a group,
users can optionally specify a color for the group to be displayed in (the group would otherwise be assigned a random color).
A color can be a word (eg. "blue"), an RGB value (eg. "rgb(0,0,255)"), or a hex value (eg. "#92d941").
Any invalid color will be ignored by the compiler and a default color would instead be applied.
To specify a group color, insert a colon after the group's size and have the color after like so:
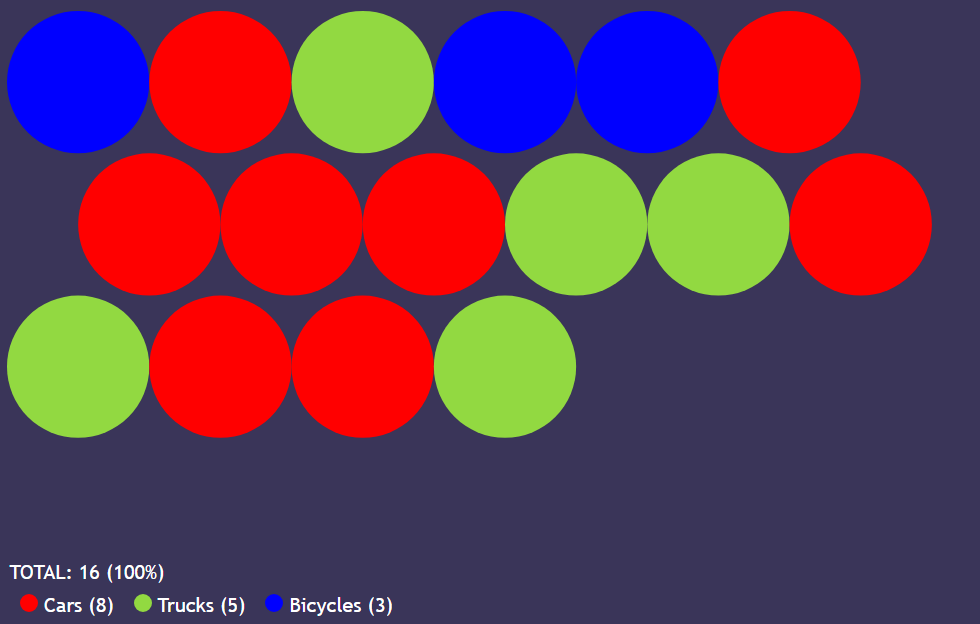
Cars: 8 : Red
Trucks: 5 : #92d941
Bicycles: 3: rgb(0,0,255)
The above code will generate the following output:
A Data Group's name cannot have any of the following:
- Colon character :
- Double slashes //
- Commas ,
- @ symbol @
Some other notes about Data Group naming rules:
- No two Data Groups may have the same name. The compiler will only register the group that is
declared last, with the group(s) declared earlier in the code being ignored.
- Data Group names are case sensitive. "Cars" and "cars" would be registered as different Data Group
names.
- Data Group names can include space characters, numbers, special characters, etc.
Settings
Hexagonal Light has several changable settings that affect the whole output graph. To change the properties
settings of the graph a user can begin a line of code with @SETTING_ followed by the setting's name in
capital letters and an equal sign before the setting's new value. Each setting has its own default value, so
a program that doesn't specify any settings will still compile successfully.
FileName
The file's main function is to give a title to the graph so people know what the data is about. The file
name is displayed above the graph and is also used when a user downloads the data from the user input
textearea. By default the file name is "Untitled File".
@SETTING_FILENAME = Poll: What's your favorite method of transportation?
//This is an example file name for the results of a poll!
Units
Units are displayed next to data values and help give context as to what the numbers mean. The number "5" by
itself doesn't mean much, but "5 cars" and "5 votes" are meaningful. Like the file name, units help people
understand the graph better.
@SETTING_UNITS = Votes
//"Votes" is a great unit choice for the results of a poll!
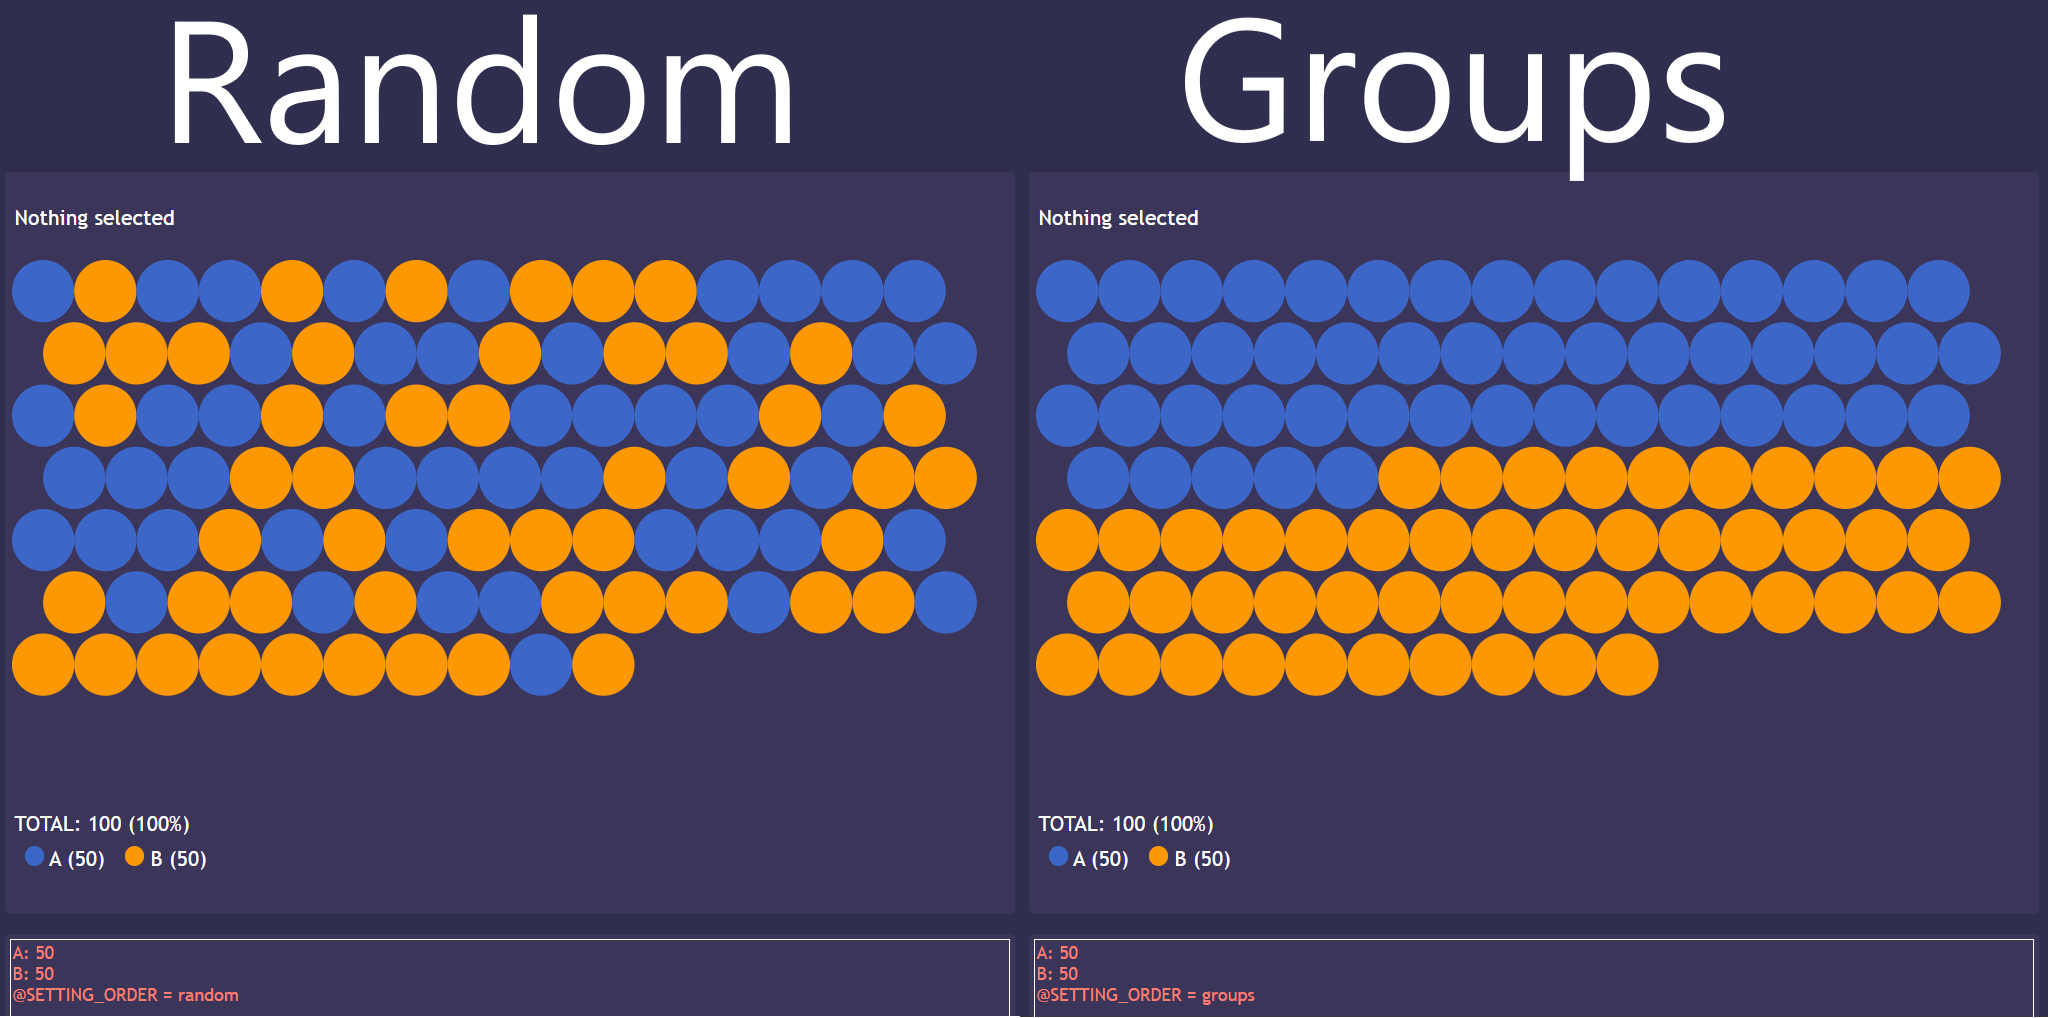
Order
By default, Hexagonal Light displays the circles in a random order since the default Order setting is
"random". The user can change the Order to "groups" to have the circles be displayed together with their
data groups. There are only two possible values for the Order Setting: "random" and "groups". A nonvalid
value can result in an
error.
@SETTING_ORDER = groups
//This will make all of the groups be displayed together
To see the difference between "random" and "groups", here is an example output for each setting:
Collections
A Collection is a collection of Data Groups that can be viewed together.
To declare a Collection, type its
name first followed by a colon character, and then type the names of each Data Group that is a member of the
collection, seperated by commas.
Cars: 8
Trucks: 5
Bicycles: 3
Vehicles: Cars, Trucks
The above code declares a Collection called "Vehicles", which has the Data Groups "Cars" and "Trucks" as its
members. When the compiler reads a Collection declaration, it will add a button underneath the graph that
can be pressed to view only the collection's Data Group members.
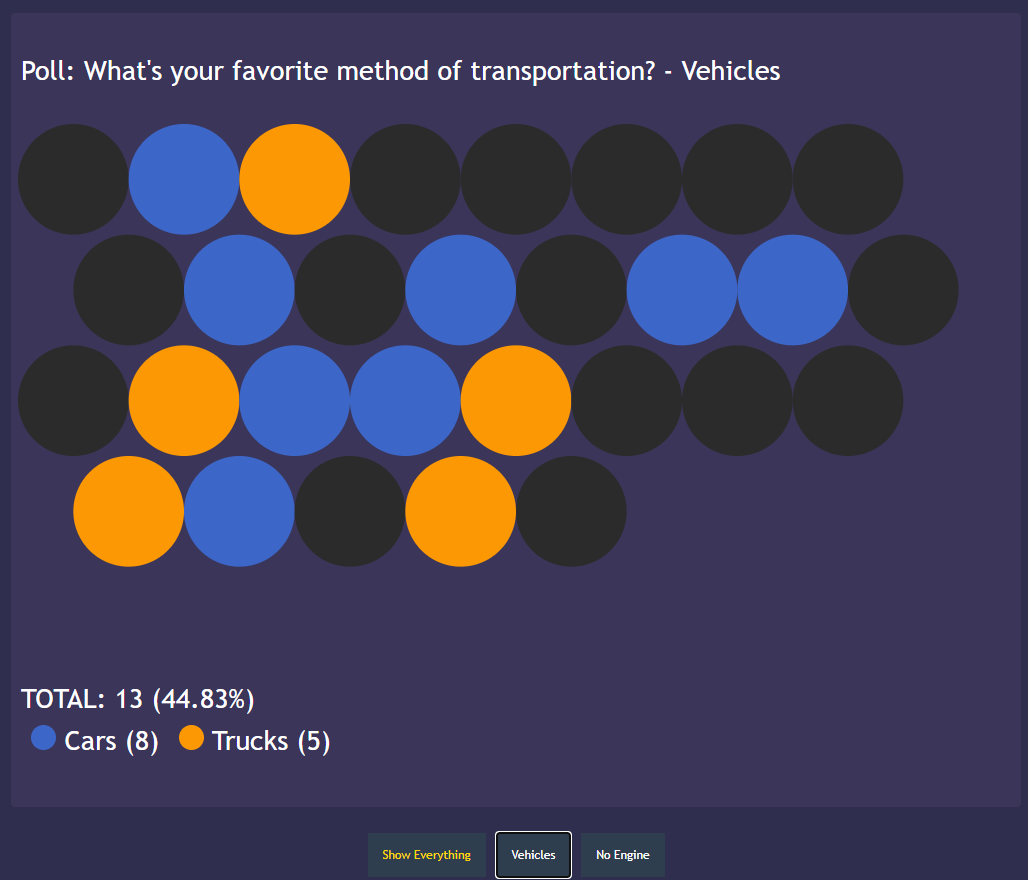
The graph above shows the result on clicking the collection button for the "Vehicles" collection. Only the
member Data Groups of
"Vehicles" ("Cars" and "Trucks") are visible, hiding Data Groups that aren't members of "Vehicles" (in this
case, the "Bicycles" Data Group).
An important thing is that when a collection button is pressed, a new button called "Show
Everything"
appears. When the Show Everything button is clicked the graph will revert to display all
data and not
any specific collection.
Notes about Collections:
- Labels for Data Groups that are not members of the Collection are temporarily hidden.
- Collections have the same naming rules that Data Groups do. Refer to the
Data Group Naming Documentation to review the naming rules that apply to both Data Groups
and Collections.
- Collections display the following statistics:
- The sum value of all Data Group members of the Collection.
- The percentage of all data from the graph that is a member of the Collection.
- Output graph circles and labels that are not part of the collection will remain hidden or unfocused
regardless of any normal mouse movements until the "Show Everything" button is pressed.
- A Collection can have unlimited Data Groups, or as few as one Data Group. The main purpose of a
Collection is to view multiple Data Groups at once, so having only one Data Group makes a Collection
mostly pointless.
Nesting Collections
In addition to containing groups, a collection can include other collections! We refer to a collection that contains another collection as a super collection,
and the collection being contained as a sub-collection.
Cars: 8 : Red
Trucks: 5 : #92d941
Bicycles: 3
Boats : 12
Vehicles: Cars, Trucks
Has Wheels: Vehicles, Bicycles
In the code above, the "Vehicles" category contains Cars and Trucks. The "Has Wheels" category contains Cars, Trucks, and Bicycles.
IMPORTANT: When nesting a sub-collection within a super collection, you MUST declare the sub-collection earlier in your code before you declare the super collection.
This rule also prevents collections from nesting in each other in a circular fashion;
it is impossible for both collectionA to be a sub-collection of collectionB and collectionB to be a sub-collection of collectionA.
Viewing Output
When viewing the output graph, users can hover their mouse (or tap on phones) over any circle to see only
members of the circle's data group. Users can also hover or tap on a Data Group label to see only the Data
Group's members. When the user moves their mouse out of the graph all Data Groups will be shown unless the
user is currently viewing a collection, in which case only Data Groups inside the collection will be shown
(to stop viewing a collection click on the "Show Everything" button).
Download and Upload
Users can both download and upload data.
Users can download the user input's data as a .txt file by clicking on the "download data" button. The data
will be downloaded promptly and the file will be titled [filename] - HexLight.txt
Users can upload a text (.txt) file by clicking on the "upload data" button. After clicking on the button
and selecting a file, the user input textarea is overwritten with the file's content and a new graph is
generated.
About this project
Hexagonal Light is a 2023 coding project by Arthur Zarins. More projects can be found on my portfolio website.